
How to make a chart of your users' window sizes
This article was originally published on the Mozilla Marketing Engineering & Operations blog.
In preparation for the MDN redesign I examined our analytics to get an idea of how wide our users’ browser windows were. I wanted window widths, not screen sizes and I thought a chart would tell a more compelling story than a table.
Here’s the chart I made:
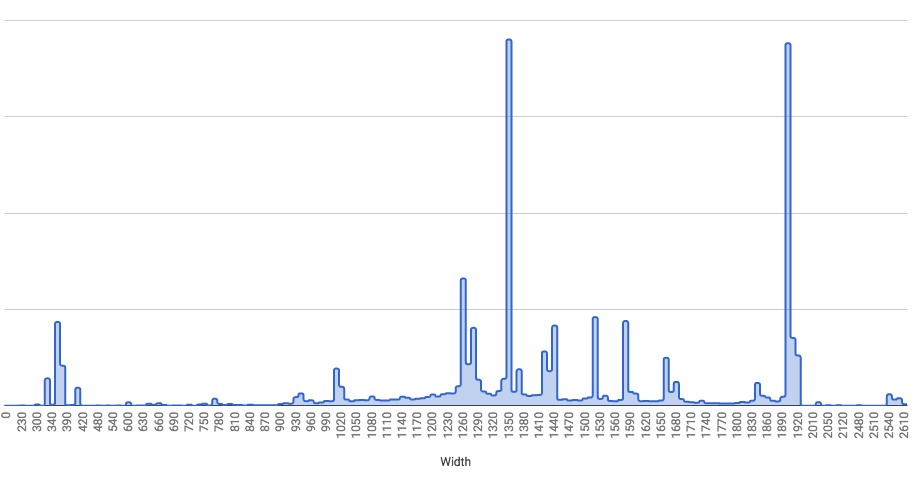
I found this view useful because it shows us “clumps” of window sizes.
How to make a chart of browser window widths
The basic idea is:
- Create and export a Custom Report for Browser Size.
- Filter the Browser Size to just include widths.
- Aggregate the number of users for each width.
- Make a chart.
Working with Google Analytics and Google Sheets the specific steps I used were:
- Create a custom report for browser sizes.
- Customization > Custom Reports > New Custom Report
- Set the Metric Group to
Users - Set Dimension Drilldowns to
Browser Size - Save
- View the custom report.
- Set Show rows: to
5000. - Export to Google Sheets.
- Delete the extra stuff from the top and bottom of the export, you just want two columns: Browser Size, and Users.
- Create a new column
Ccalled Width. Add this regex to it and fill down:=REGEXEXTRACT(A2, "^[0-9]+"). This gives you a column with just the width part of the browser size. - Create a new column
Dcalled Unique List. Add this formula to it (you don’t need to fill down):=UNIQUE(C2:C5001).This gives you a list of widths with no repeating values. That means 1900x950 and 1900x970 will be treated the same in our final chart. - Create a new column
Ecalled Conditional Sums. Add this formula and fill down the height of your Unique List:=SUMIF(C$2:C$5001,D2,B$2:B$5000). - Copy the Unique List and Conditional Sums columns.
- Create a new sheet in your document.
- Use Edit > Paste special > Paste values only to paste only the computed values of these columns.
- Rename Unique List to Width and Conditional Sums to Total Users.
- Find the (not set) row and delete it.
- Make sure both columns are being treated as numbers (a hint this is happening properly is that they are right aligned). If you have headings on the columns make sure they’re frozen (View > Freeze > 1 row).
- Sort on Width from A→Z.
- Select both columns and create a chart (Insert > Chart). (I made a “Stepped area chart”)
- Set Width as the X-axis.
- Done!
This answered a question I’ve been curious about for ages: Do people with large monitors use MDN full screen?
About 40% of our users have a screen resolution of 1900px or wider and 25% of our users use MDN at 1900px or wider.